[G05] Charts & diagrams
Module: Strategic reasoning
- G00. Introduction
- G01. Overview
- G02. Classifying problems
- G03. Solving problems
- G04. Complex systems
- G05. Charts & diagrams
- G06. SWOT analysis
- G07. The 7-S framework
- G08. Making good decisions
- G09. Decision by pros and cons
- G10. Formal decision theory
Quote of the page
Who controls the past controls the future: who controls the present controls the past.
- George Orwell
Help us promote
critical thinking!
Popular pages
- What is critical thinking?
- What is logic?
- Hardest logic puzzle ever
- Free miniguide
- What is an argument?
- Knights and knaves puzzles
- Logic puzzles
- What is a good argument?
- Improving critical thinking
- Analogical arguments
Charts and diagrams play an extremely important role in displaying information and assisting reasoning. They help us visualize complex processes, or make explicit the structure of problems and tasks. On this page we introduce some common visual tools.
§1. Flowcharts
A flowchart is a diagram constructed from connected shapes representing a process or a plan. Here is an example of a simple flowchart illustrating the process of going to school.
Flowcharts have two main functions. First, a flowchart can be used to analyse a complex process, by breaking down the process into individual steps or components. The diagram can then be used :
- as a basis for further discussion of the process
- to identify points where data can be collected and analysed
- to identify bottlenecks and inefficiencies
- to explain the process to other people
A flowchart can also be used to define a process or project to be implemented. Such a diagram is useful because :
- it spells out clearly the steps that have to be implemented
- it provides the basis for identifying potential problems
- responsibilities for different parts of the process can be clearly defined
The modern flowchart originated in computer science as a tool for representing algorithms and computer programs, but the use of flowcharts has extended to the representation of all other kinds of processes.
Notation
In a standard flowchart, different shapes have different conventional meanings. The meanings of some of the more common shapes are as follows:

| The terminator symbol represents the starting or ending point of the system. |

| A box indicates some particular operation. |

| This represents a printout, such as a document or a report. |

| A diamond represents a decision or branching point. Lines coming out from the diamond indicates different possible situations, leading to different sub-processes. |

| It represents material or information entering or leaving the system. An input might be an order from a customer. An output can be a product to be delievered. |

| This symbol would contain a letter inside. It indicates that the flow continues on a matching symbol containing the same letter somewhere else on the same page. |

| As above, except that the flow continues at the matching symbol on a different page. |

| Identifies a delay or a bottleneck. |
|
| Lines represent the sequence and direction of a process. |
For further information about standard notation, please refer to :
- International Organisation for Standardisation (ISO), ISO 5807 Information processing -- Documentation symbols and conventions; program and system flowcharts.
- American National Standard, ANSI X3.6-1970, Flowchart Symbols and their Usage in Information Processing.
Deployment flowcharts
One type of flowchart which is quite useful in project planning is deployment flowchart. A deployment flowchart is just a flowchart drawn inside a table with different columns, e.g.
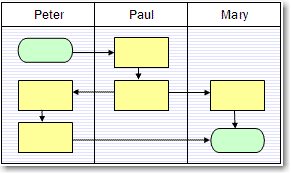
The table is divided into columns representing the parties responsible for implementing the process. Different parts of the process are placed in the column for which the relevant party is in charge. The diagram reveals clearly how responsibilities for the sub-processes are distributed.
Hints for drawing flowcharts
- Write down the title of the flowchart. Identify the process that is shown.
- Make sure that the starting and ending points of the process can be easily located.
- Avoid crossing flow-lines if possible.
- Use informative labels in your diagram.
- The amount of details in a flowchart depends on the level of analysis required.
Analysing flowcharts
In a management context the following considerations should be taken into account in reviewing a flowchart:
- Where are the labor intensive processes?
- Where would possible delays and hiccups most likely occur?
- Are there places particularly suited for quality control?
- Are there duplicated or redundant processes?
- Is it possible to streamline any process or reduce the number of operations?
- Has any process been omitted?
§2. Decision trees
A decision tree diagram is a diagram that represents the possible consequences of a series of decisions in some situation. Here is a simple example :
More sophisticated decision tree diagrams can represent the probabilities of different possible outcomes. Special methods can then be employed to calculate the overall probabilities of possible final outcomes, to help estimate risks and assist decision making.
A decision tree diagram functions not just as a map for making decisions. It is also very useful in laying out the different positions on some complicated theoretical issue. Depending on how one might answer certain crucial questions, a decision tree diagram can help the user identify the theoretical consequences of the assumptions that he or she accepts. For example, here we have a very simple tree diagram on the topic of consciousness.
§3. Cause and effect diagrams
There are two main types of cause and effect diagrams - Bayesian causal nets, and fishbone diagrams. Bayesian causal nets are rather similar to decision tree diagrams. For more details, please visit this page.
It is hard to describe systematically the art of using diagrams to present relevant information accurately and succintly. But here are a few simple reminders on interpreting and presenting charts containing statistical information: